
Energy Snapshot
Bill-led analytics, reporting, CO2 tracking, and a clear energy-performance rating.
B2B SaaS / Analytics / Platform adoption
A platform redesign and delivery system that moved enterprise customers toward deeper operational use across web and mobile.
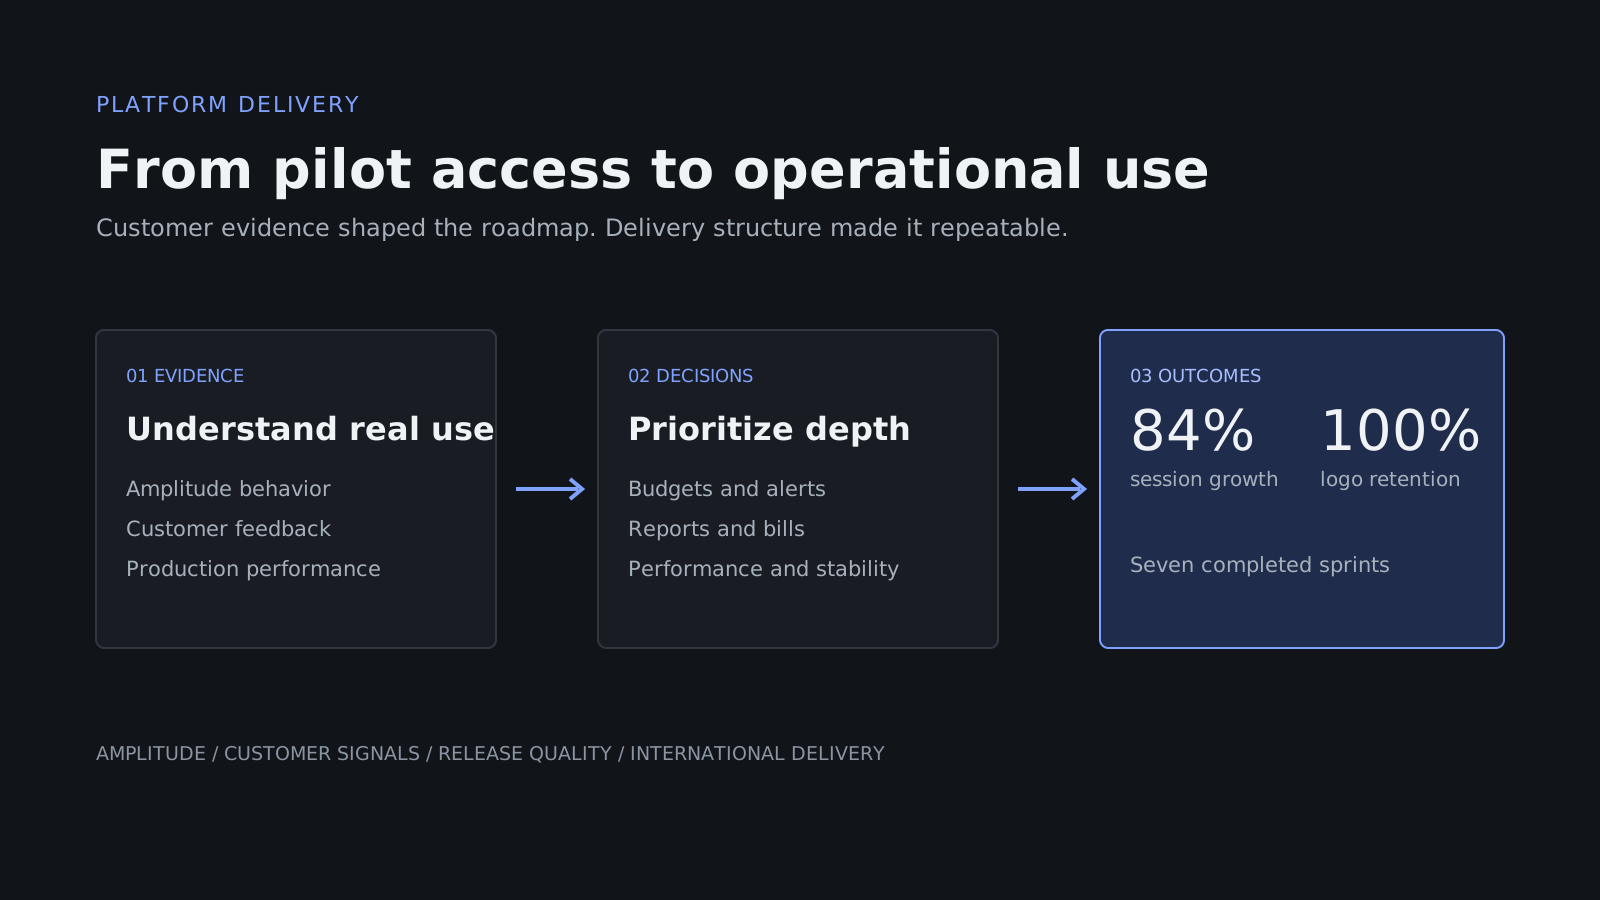
Product evidence map connecting customer behaviour, analytics signals, roadmap choices, and outcomes.
Watt Footprint operated across energy studies, physical project implementation, and software. The software team was the newest group. When I joined, its backlog sat in a shared workspace with other departments, external delivery happened through Slack, and there was no consistent sprint or release structure.
At the same time, customers were moving beyond pilots. New accounts, international markets, and larger IoT deployments increased the cost of unclear priorities and unstable releases.
The product served two enterprise experiences. Energy Snapshot customers used bills for analytics, reporting, CO2 tracking, and a familiar rating model. Energy Pro customers used live meters for real-time electricity, gas, water, and solar monitoring.
Bill-led analytics, reporting, CO2 tracking, and a clear energy-performance rating.
Live utility data, site trends, bill management, sensors, gateways, and operational alerts.
The roadmap needed to support both experiences while improving the shared platform foundation. That meant balancing visible customer value with identity, performance, data quality, and release stability.
I reviewed Amplitude weekly to understand how external customers used the platform. The useful question was not whether someone logged in. It was whether accounts were using the workflows that turned energy data into operational decisions.
Across seven completed sprints, the team delivered a redesigned dashboard, analytics and bills, multi-currency support, budgets, alerts, reporting, role-based administration, mobile work, and performance improvements.
Budget tracking, configurable alerts, reporting, notes, and multi-site administration.
GBP and AED support, regional bill formats, customer onboarding, and compliance coordination.
Identity and access, technical debt, release quality, data performance, and mobile experience.
Some established customer accounts experienced infographic load times above two minutes because of larger data volumes and under-sized compute. The issue affected the customers using the platform most deeply, so it could not be treated as invisible technical work.
That change protected the workflows generating the strongest adoption signal and reduced the gap between product promise and daily customer experience.
External sessions grew by 84%, repeat use increased, and core reporting and energy-management actions grew substantially. All seven completed sprints reached their committed scope, while logo retention remained at 100% across the engagement.
The important outcome was not a longer feature list. Customers moved from passive access toward budgets, reporting, live monitoring, alerts, and multi-site management as operational workflows.
I would segment analytics by persona earlier. Sustainability leads, site managers, and account administrators use the platform differently. Role-based cohorts would have made prioritization more precise.
Connect account-level adoption to renewal and expansion signals, then test whether quarterly value summaries can create the same customer engagement as the annual energy report.
I am based in Dublin and interested in Product Manager opportunities across Ireland and the EU.